Teach for Poland
Turning student surveys into evidence in minutes, not weeks.
An evidence platform that imports raw survey data and instantly reveals how students across Poland feel about belonging, agency and their classrooms. School by school, cohort by cohort.

The dashboard, live.
A working replica of the staff portal, running on sample data. Pick a dimension or apply a filter, and the questions, charts and response counts recompute in real time, just like the real thing.
Question Breakdown
Answer distribution for each question in the selected dimension.
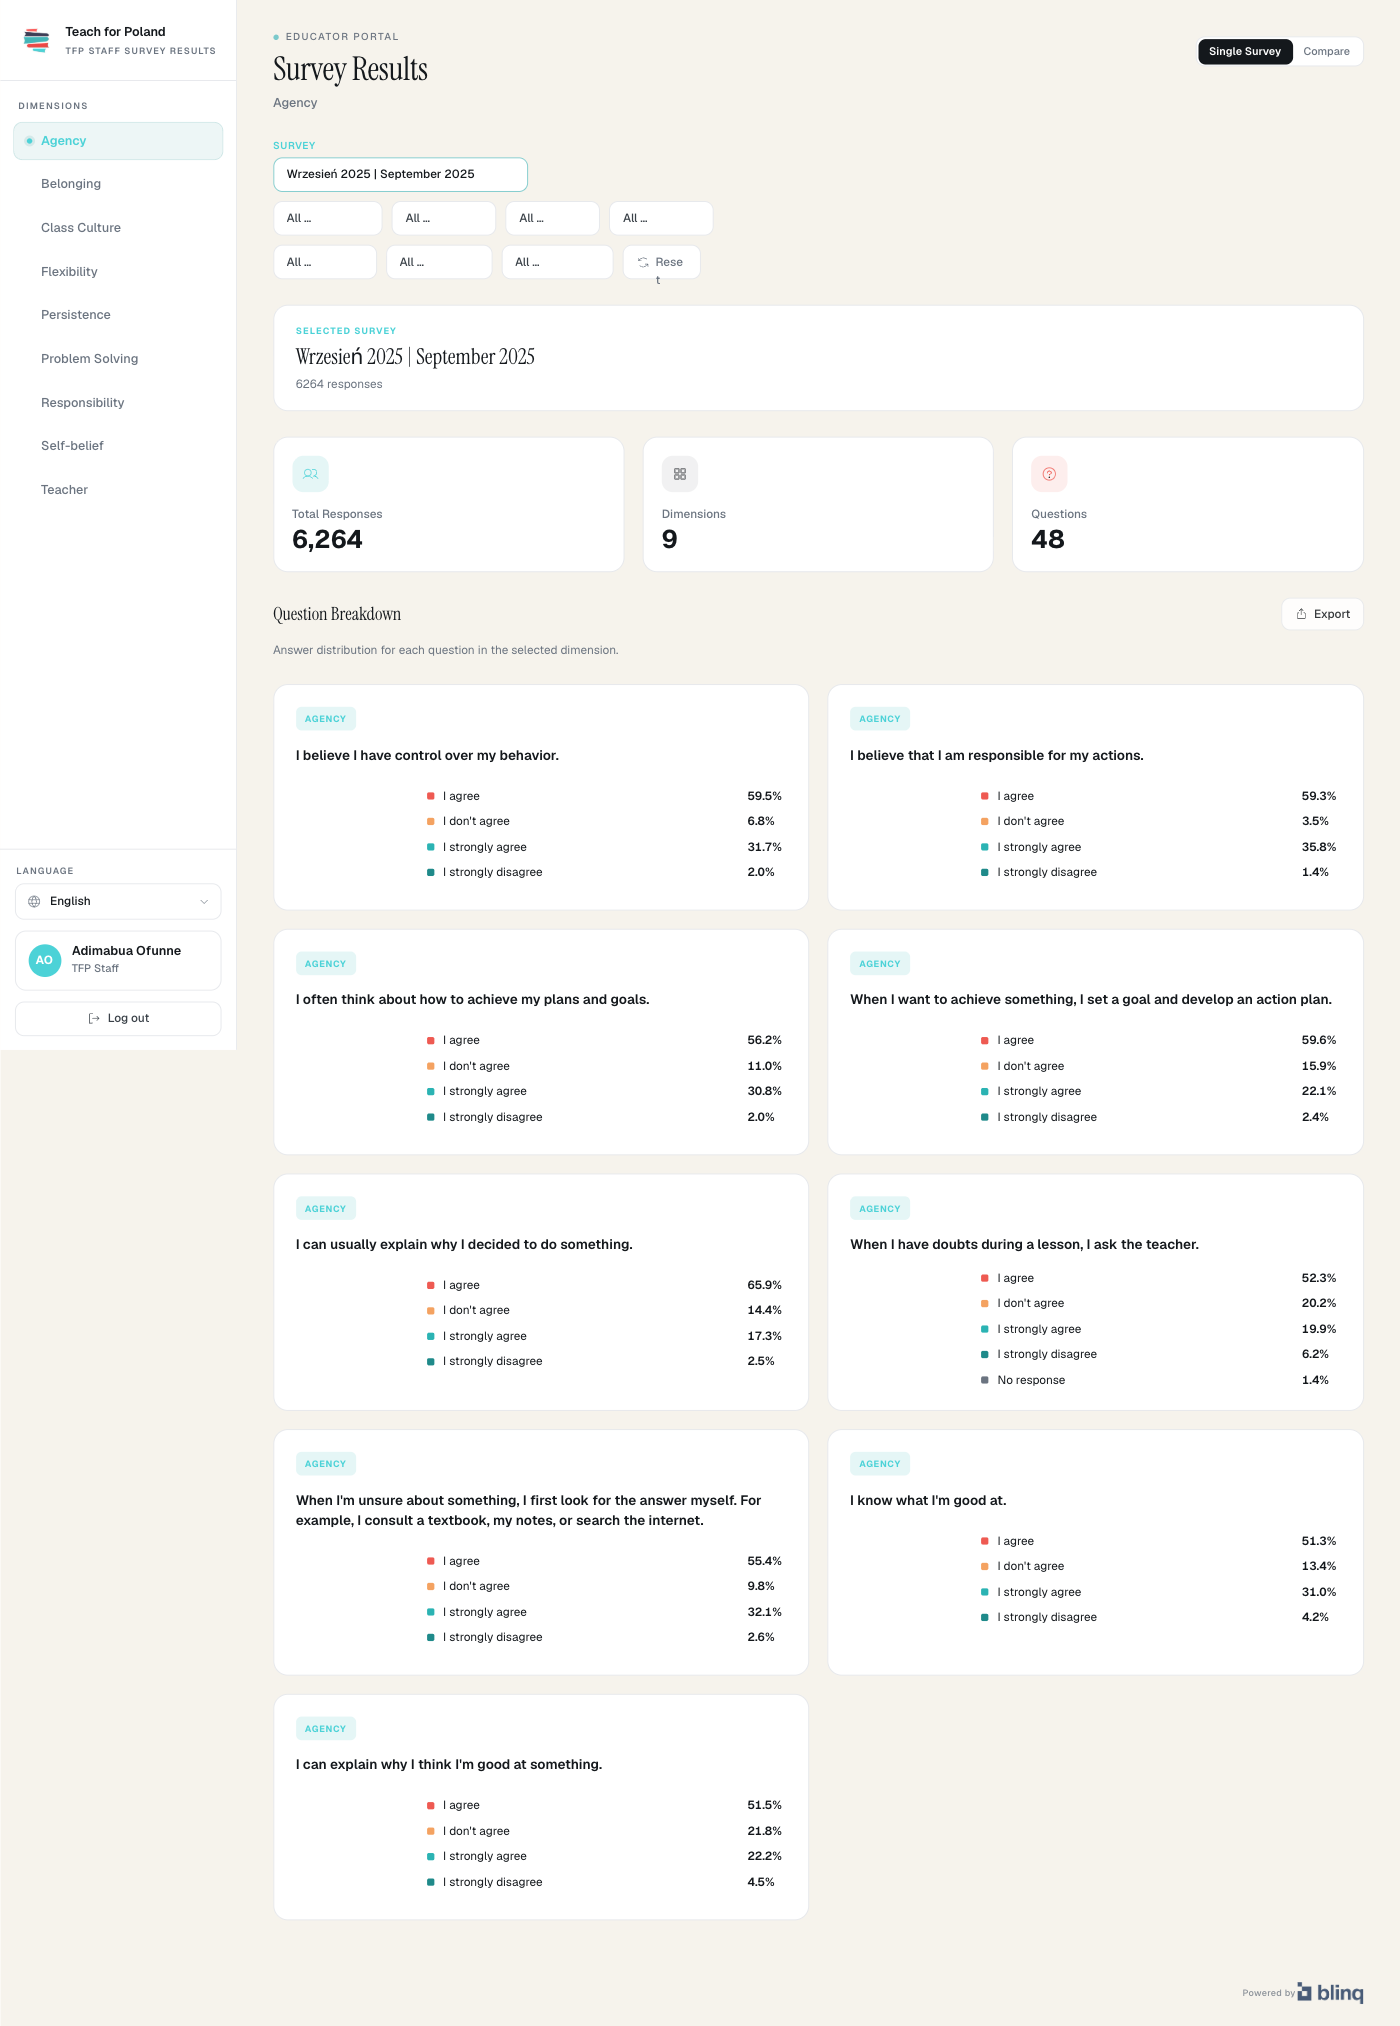
Explore the live, interactive demo on a desktop screen.
The data was rich. Reaching it was slow.
Teach for Poland measures what most education systems overlook: belonging, agency, confidence, safety, the texture of a classroom. Every round, thousands of students respond.
But turning those responses into something a teacher could act on meant exporting CSVs, cleaning rows, and rebuilding spreadsheets and charts by hand. One MERL lead. Roughly a week of work after every single survey round.
From raw upload to living evidence.
One continuous flow, from the survey file to a decision a teacher can make today.
Raw files, straight in.
Survey files drop straight in. Rows are validated, de-duplicated and mapped to dimensions automatically.
Charted the moment it lands.
The moment an import finishes, every question is charted. No spreadsheets, no manual setup.
Answers in seconds.
Slice by school, cohort, tutor, class, survey or period. Answers in seconds, not rebuilt spreadsheets.
Movement, year on year.
Compare survey waves side by side to see genuine movement in wellbeing over the school year.
Imported, not wrangled.
CSV or XLSX files upload straight into the platform. A four-row header maps every question to its dimension in Polish and English; rows are validated and de-duplicated, and teacher accounts are provisioned automatically. On a background job built to handle thousands of rows without timing out.
Each filter narrows the others, only valid combinations stay selectable.
Answers in seconds, not rebuilds.
Staff slice every result by school, cohort, tutor, class, survey or period. Filters are faceted, pick one and the rest narrow to what's actually possible. No dead ends, no empty charts, no rebuilding a spreadsheet to ask a new question.
Two waves, side by side.
Compare mode links survey rounds together. For every matched question it sets the 2024 baseline against 2025, combines “agree” and “strongly agree”, and surfaces the shift. So real progress in belonging or agency is visible at a glance, not buried. One click exports the whole comparison to CSV.
“I feel accepted in my class.”
+6 pts agreeBoring where it counts.
A deliberately conventional Rails stack. Uploads run on a background queue with a 30-minute ceiling, so a survey of any size lands without a timeout.
CSV or XLSX, read with Roo.
Background job, 30-min ceiling.
Validate, dedupe, map to dimensions.
Responses, answers, questions.
Aggregated live via Hotwire.
- Ruby 3.2
- Rails 7.2
- PostgreSQL
- Hotwire
- Turbo + Stimulus
- Chart.js
- Solid Queue
- ActiveAdmin
- Tailwind
- Devise
What the numbers do for students.
Two survey waves across the network.
What used to take the MERL (Monitoring Evaluation Research and Learning) lead roughly a week of exporting, cleaning and charting now happens in about five minutes. The strongest measurable outcome of the project.
Student voices imported, cleaned and charted across the network every round. Duplicates automatically flagged and teacher accounts provisioned on the way in.
Across the Teach for Poland network, all reporting from one dashboard.
Belonging, agency, self-belief, class culture and more — tracked over time.
Every question and label in Polish and English.
“The time I used to lose to spreadsheets now goes back to working with teachers and students.”
FanBants .
An immersive fantasy football platform built for real fans across 70+ leagues.